IRS debt statistics: what the numbers actually measure
There is no single official figure that answers every question about unpaid IRS tax. Collection accounts, accounting balances, annual compliance gaps and balances due when filing are different measures. Adding them together would not produce a valid total or a count of people who need help.
This resource uses official reporting checked on 12 and 13 November 2026. The collection inventory series runs through Fiscal Year 2025. The FY2026 financial report provides a newer accounting measure, while the geographic comparison uses Tax Year 2023 filing data.

Which measure answers your question?
If the table is clipped, scroll sideways. Use arrow keys when focused.
| Measure | What it describes | What it does not establish |
|---|---|---|
| Taxpayer delinquent accounts | Tax modules in collection inventory and their assessed balances | Unique people owing money |
| Financial-report unpaid assessments | Accounting categories including agreed receivables, compliance assessments and write-offs | The same inventory as the Data Book collection table |
| Tax gap | Tax not paid voluntarily and on time for a specified tax year | Current outstanding collection debt |
| Tax due at filing | Returns reporting an amount due when filed | Balances still unpaid today |
An IRS fiscal year ends on September 30. A tax year and a publication year are separate labels. A report published in 2026 can describe FY2025 or an earlier tax year.
FY2025 collection inventory
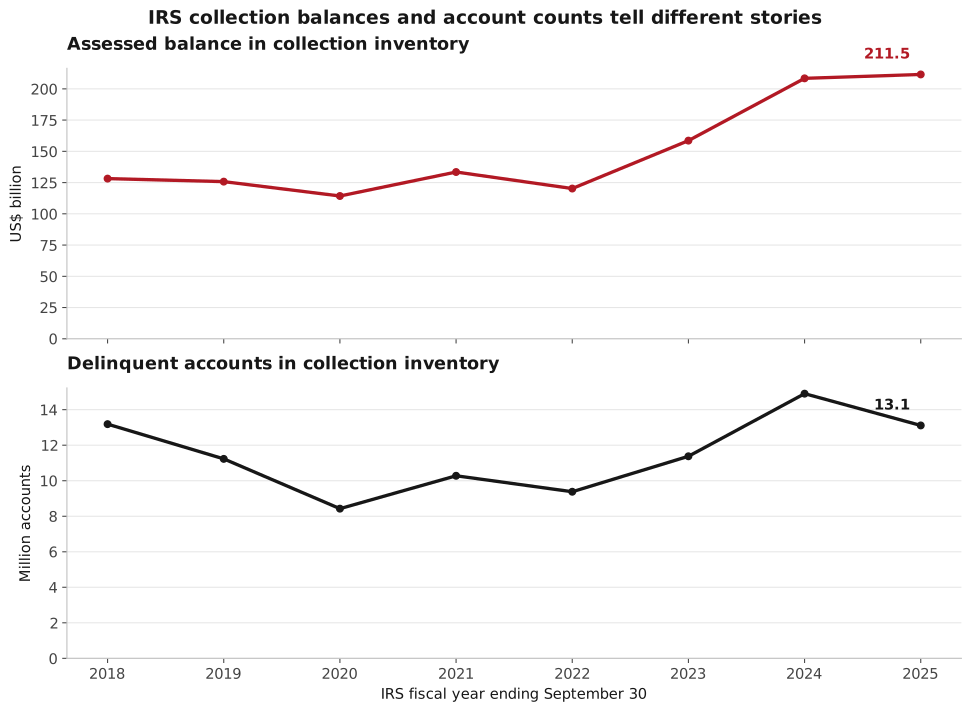
At the end of FY2025, the Data Book collection table reported 13,112,485 delinquent accounts with an assessed balance of $211.5 billion, rounded. One taxpayer may have more than one tax module, so the account count should not be relabelled as 13.1 million people.
The balance includes assessed tax, penalties and interest. The table excludes accrued penalties and interest that have not been assessed. Its figure therefore does not include every charge that may have continued to accrue.
Account counts and dollars moved differently in FY2025. Ending accounts fell from the FY2024 figure, while the assessed balance increased. That is why a statement that IRS debt simply improved or worsened needs a defined measure.
On smaller screens, scroll the chart sideways to read its labels. The source series is available in the downloads below.
Payment agreements and offers are different programs
For FY2025, the IRS reported 3,160,047 new installment agreements and 4,870,810 taxpayers in installment agreements at year end. New agreements established during the year are not the same as the ending inventory. Neither number should be added to delinquent accounts to create a unique market-size count.
The IRS received 38,797 offers in compromise and accepted 5,464 during FY2025. Those are annual flows. The offers received and accepted in a fiscal year are not necessarily the same cohort, and a ratio between them is not an individual’s probability of obtaining an offer.
Other publications may report an offer decision rate using a different denominator. Preserve the source definition when comparing it with Data Book figures. Eligibility for an offer remains a case-specific question.
Collection events also need precise labels. For example, a count of levy notices requested, lien notices filed or seizures is not a count of unique people affected by all enforcement actions. A person can appear in more than one administrative series.
The FY2026 financial-report figures
The IRS FY2026 Agency Financial Report reports $518.548 billion in total unpaid assessments as of September 30, 2026. This is a broader accounting stock than the Data Book’s assessed collection inventory.
The report divides total unpaid assessments into gross federal taxes receivable, compliance assessments and write-offs. Gross receivables include particular nondelinquent and delinquent categories. Write-offs are not a published count of taxpayers in currently-not-collectible status.
The report’s total declined from FY2025, but its explanation identifies a substantial reduction in transition-tax installment balances under section 965(h). The separately listed delinquent taxes receivable category increased from $329.865 billion to $335.763 billion. It would be misleading to interpret the overall decrease as proof that every ordinary delinquent balance category improved.
Use the right collectibility denominator
The report’s estimated collectibility table gives 17.8% for a broader delinquent gross balance of $339.398 billion, with $60.464 billion net. That denominator differs from the $335.763 billion category in the earlier breakdown.
These are accounting estimates of collectibility, not a discount offered to each taxpayer. They do not imply that an individual can settle for a corresponding percentage of the balance.
The tax gap is an annual flow
The IRS tax-gap page checked for this resource reports the Tax Year 2022 projection: a $696 billion gross gap and $606 billion net gap. The gross figure includes nonfiling, underreporting and underpayment. The $94 billion underpayment component concerns tax reported on time but not paid on time.
The gap is not another collection-inventory account that can be added to the FY2025 or FY2026 balances. It includes liability that may not have been assessed. The calendar period, estimation process and compliance question differ.
What can be compared across states?
The verified SOI Historic Table 2 data supports a comparison of tax due when individual returns were filed for Tax Year 2023. It provides the number of returns owing and the dollar amount for every state and DC.
The IRS documentation describes a 2024 processing window and includes limited earlier-year returns as proxies. State assignment follows the return address, which can differ from actual residence. This is not a complete matched population of state residents.
Our state filing comparison shows the share of returns owing and the average per return with a filing balance. It includes the source data and formulas. It is not titled or interpreted as current delinquent IRS debt per state.
Population-based estimates cannot close that gap. Allocating national collection debt in proportion to residents would create a model, not an official geographic debt table. Likewise, Google Trends interest is not evidence of the amount owed in a state.
Industries and professional supply need separate evidence
Sole-proprietorship returns and the tax gap can describe filing activity or compliance patterns. They do not establish which named industry has the largest outstanding IRS collection balance. We do not use them to claim that construction, trucking or another industry leads an unpublished debt ranking.
PTIN statistics also require care. Credential categories can overlap, and a tax-return preparer count is not a count of practitioners currently taking collection cases. Those figures cannot establish a precise shortage of IRS-debt professionals without additional evidence.
Methodology and update policy
The collection series is extracted from the IRS Data Book spreadsheets, retaining fiscal year, original units, metric name and source cell. Financial-report amounts are retained in millions of dollars before display conversion. SOI filing figures retain their tax year and the source’s nearest-ten count rounding.
Charts use the checked numerical data rather than generated imagery. Data changes require a new source capture, calculation checks and review of affected charts and prose. A new file download is not automatically a new reporting period.
The available evidence does not establish state delinquent balances, current debt by industry, unique taxpayer counts derived from accounts, or a precise practitioner supply-demand ratio. Those remain gaps.
Sources and downloads
- IRS collection activities and tables.
- IRS FY2025 delinquent collection spreadsheet.
- IRS FY2026 financial report, accounting balances and collectibility tables.
- IRS tax-gap definitions and projections.
- IRS TY2023 Historic Table 2 CSV.
- IRS TY2023 documentation guide, including population and return-address limitations.
- Download the collection series.
- Download the state filing comparison.
For an individual decision, the guide index separates proposed adjustments, payment-plan problems and large balances from these national statistics.