Tax due at filing by state
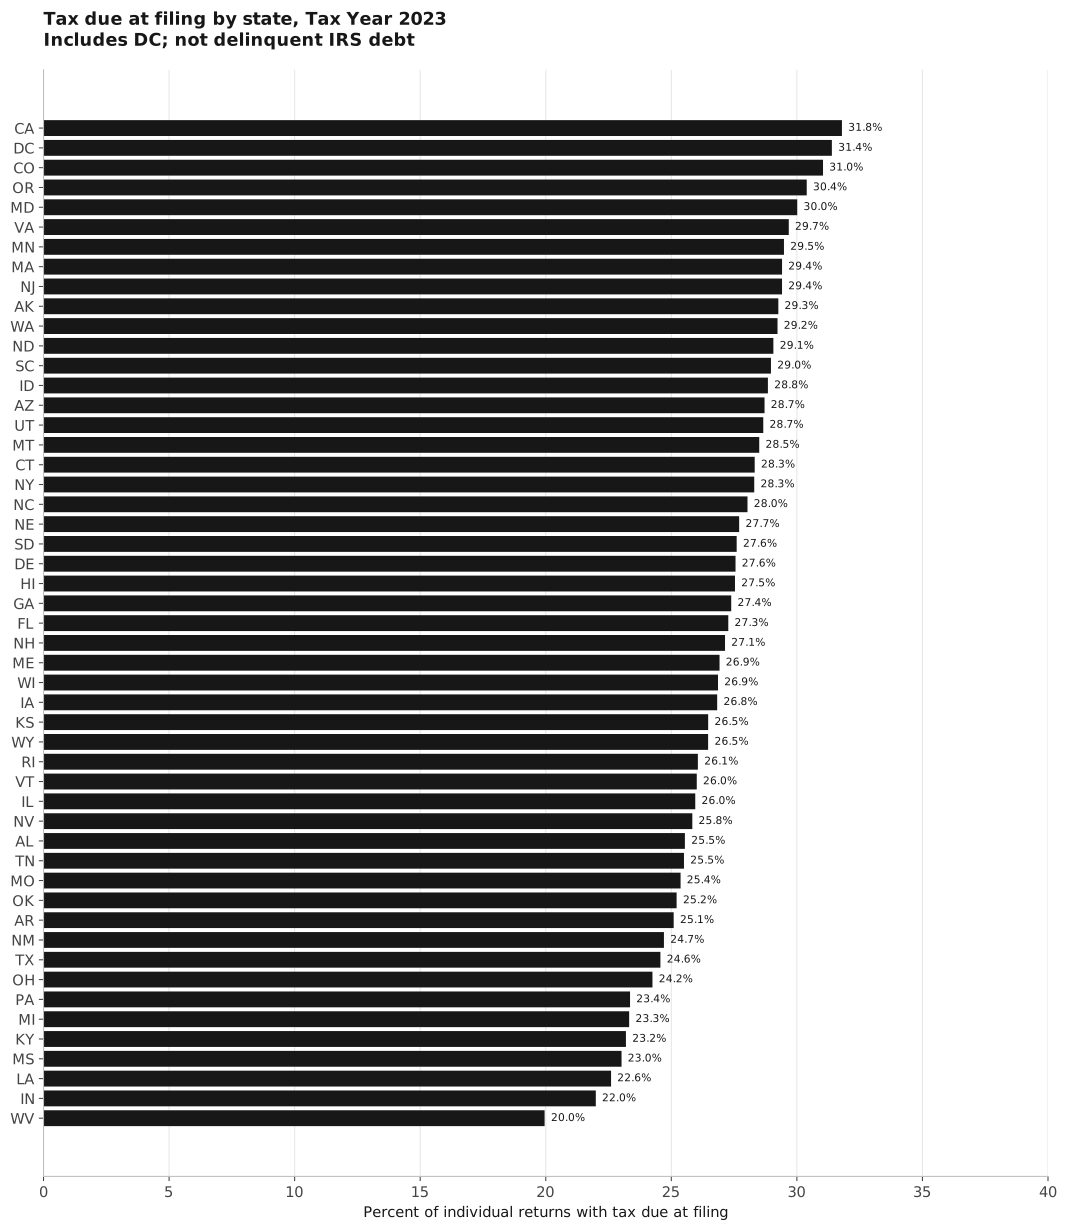
This comparison covers all 50 states and the District of Columbia. It measures tax due when individual income-tax returns were filed for Tax Year 2023. It does not measure current delinquent IRS debt.
For a practical guide to handling both agencies, see IRS debt and California tax issues. That guide addresses records and procedures, rather than the filing statistics below.
For a resident income-tax reporting or bill issue, IRS changes and New York tax debt explains the federal-event, state-response and existing-payment-agreement records. It serves a different purpose from this statistical comparison.
Read the measure correctly
The IRS Statistics of Income tables count returns, not unique people. Amounts were published in thousands of dollars, and return counts were rounded to the nearest ten. A filing balance may subsequently have been paid; it cannot be described as an amount still owed today.
The underlying TY2023 tables use returns processed during 2024 and include limited earlier-year returns as proxies. Geography follows the address on the return; it can differ from actual residence. The data does not describe every person living in a state.
The share below divides returns with tax due at filing by all individual returns in the same state table. The average divides the reported dollar amount by returns owing. It is an average for returns with a filing balance, not for every resident.
On smaller screens, scroll the chart sideways to read its labels. The full comparison table follows.
Filing amounts relative to population
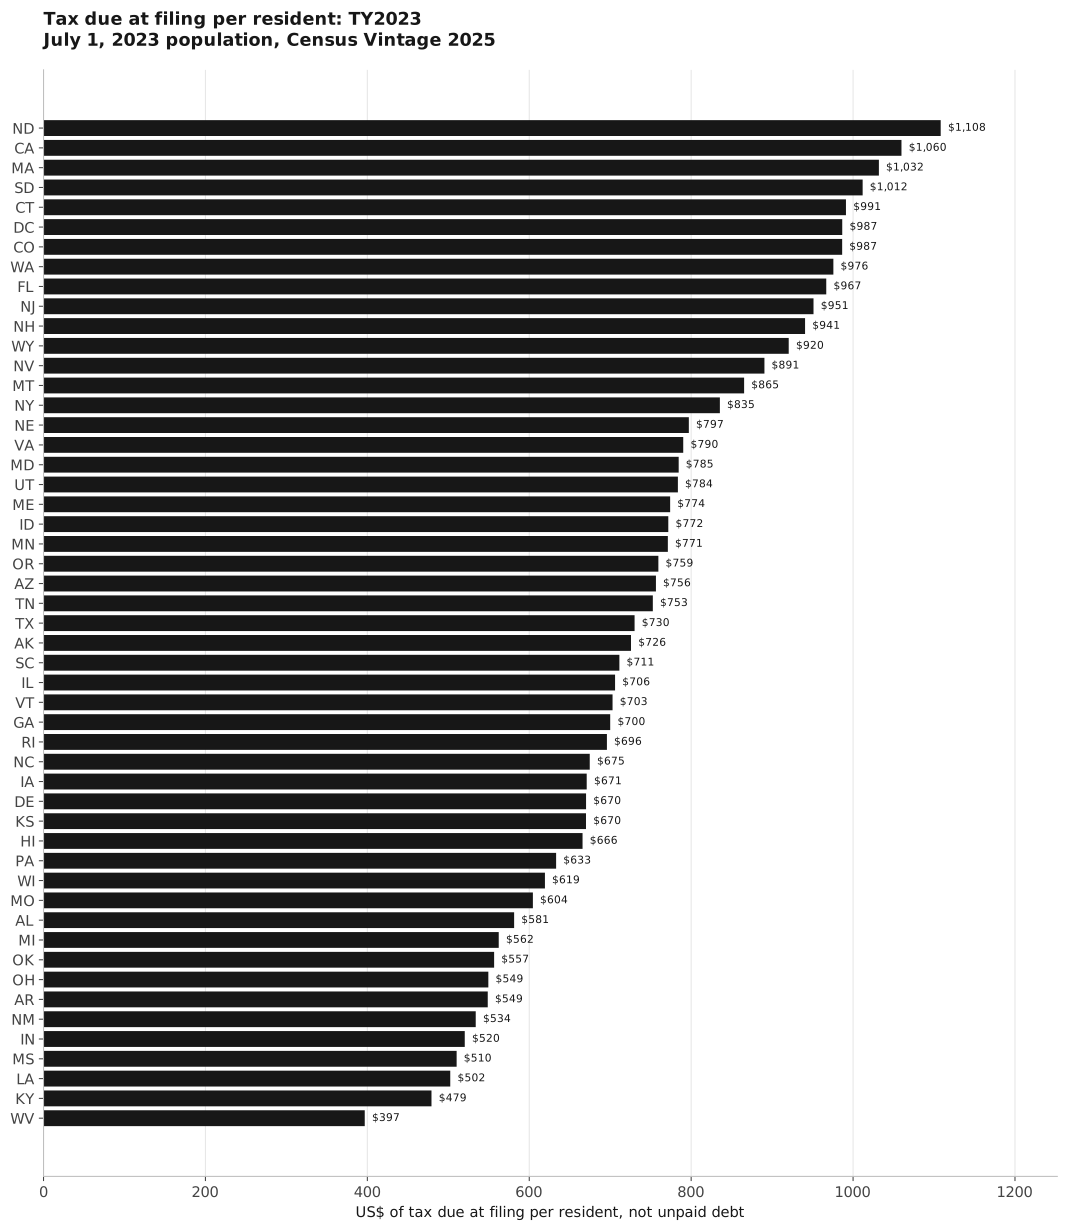
The final table column provides a secondary comparison: TY2023 tax due at filing per July 1, 2023 resident, using Census Vintage 2025. It divides the state’s filing amount in dollars by its estimated resident population. It does not measure current unpaid IRS debt per person or the share of people who owe tax.
The population estimate includes children and people who do not file returns. One return can cover a married couple. IRS geography follows a return address, which can differ from residence, while the Census denominator describes residents. The IRS data was mainly processed during 2024 with limited earlier-year proxies, so these sources do not identify an identical group of people at one moment.
Vintage 2025 supplies revised estimates for July 1, 2023. It is not a 2025 population denominator for a 2023 filing amount. Use one population vintage consistently across all 51 jurisdictions.
For the 50 states and DC together, the combined filing amount divided by their combined population is approximately $781 per resident. That is a contextual ratio, not a typical person’s debt. Filing, income, withholding and population differences can affect the comparison. It cannot identify distress, noncompliance or a need for representation.
Scroll this chart sideways on smaller screens. The table below gives both the existing filing measures and the population-based context.
State comparison
On smaller screens, each state is followed by its labelled figures.
| State | Returns with tax due | Share of returns | Average per return owing | Filing amount per resident |
|---|---|---|---|---|
| Alabama | 546,780 | 25.5% | $5,441 | $581 |
| Alaska | 101,810 | 29.3% | $5,236 | $726 |
| Arizona | 973,650 | 28.7% | $5,790 | $756 |
| Arkansas | 324,260 | 25.1% | $5,195 | $549 |
| California | 5,876,280 | 31.8% | $7,066 | $1,060 |
| Colorado | 958,180 | 31.0% | $6,087 | $987 |
| Connecticut | 516,110 | 28.3% | $6,993 | $991 |
| Delaware | 139,820 | 27.6% | $4,962 | $670 |
| District Of Columbia | 109,450 | 31.4% | $6,153 | $987 |
| Florida | 3,058,990 | 27.3% | $7,247 | $967 |
| Georgia | 1,336,890 | 27.4% | $5,793 | $700 |
| Hawaii | 191,500 | 27.5% | $4,989 | $666 |
| Idaho | 255,190 | 28.8% | $5,959 | $772 |
| Illinois | 1,583,210 | 26.0% | $5,634 | $706 |
| Indiana | 712,990 | 22.0% | $5,022 | $520 |
| Iowa | 397,560 | 26.8% | $5,426 | $671 |
| Kansas | 361,570 | 26.5% | $5,467 | $670 |
| Kentucky | 459,410 | 23.2% | $4,746 | $479 |
| Louisiana | 436,760 | 22.6% | $5,290 | $502 |
| Maine | 191,700 | 26.9% | $5,661 | $774 |
| Maryland | 930,470 | 30.0% | $5,232 | $785 |
| Massachusetts | 1,057,490 | 29.4% | $6,902 | $1,032 |
| Michigan | 1,136,270 | 23.3% | $4,979 | $562 |
| Minnesota | 855,860 | 29.5% | $5,184 | $771 |
| Mississippi | 283,020 | 23.0% | $5,305 | $510 |
| Missouri | 728,150 | 25.4% | $5,152 | $604 |
| Montana | 157,870 | 28.5% | $6,198 | $865 |
| Nebraska | 263,560 | 27.7% | $6,013 | $797 |
| Nevada | 404,230 | 25.8% | $7,074 | $891 |
| New Hampshire | 198,720 | 27.1% | $6,634 | $941 |
| New Jersey | 1,368,690 | 29.4% | $6,529 | $951 |
| New Mexico | 242,270 | 24.7% | $4,670 | $534 |
| New York | 2,770,530 | 28.3% | $5,967 | $835 |
| North Carolina | 1,380,300 | 28.0% | $5,314 | $675 |
| North Dakota | 107,920 | 29.1% | $8,082 | $1,108 |
| Ohio | 1,377,050 | 24.2% | $4,712 | $549 |
| Oklahoma | 429,320 | 25.2% | $5,267 | $557 |
| Oregon | 628,390 | 30.4% | $5,137 | $759 |
| Pennsylvania | 1,471,720 | 23.4% | $5,597 | $633 |
| Rhode Island | 148,750 | 26.1% | $5,152 | $696 |
| South Carolina | 720,690 | 29.0% | $5,321 | $711 |
| South Dakota | 122,800 | 27.6% | $7,562 | $1,012 |
| Tennessee | 831,320 | 25.5% | $6,476 | $753 |
| Texas | 3,358,420 | 24.6% | $6,678 | $730 |
| Utah | 442,110 | 28.7% | $6,113 | $784 |
| Vermont | 87,180 | 26.0% | $5,222 | $703 |
| Virginia | 1,236,980 | 29.7% | $5,578 | $790 |
| Washington | 1,105,410 | 29.2% | $6,919 | $976 |
| West Virginia | 155,140 | 20.0% | $4,527 | $397 |
| Wisconsin | 790,900 | 26.9% | $4,644 | $619 |
| Wyoming | 74,720 | 26.5% | $7,203 | $920 |
What this table cannot tell you
These figures cannot establish which state has the most delinquent IRS debt, the number of people in collection, the severity of an individual case or how much debt can be reduced. They also do not rank available professionals.
For the federal collection series and different national definitions, see IRS debt statistics.
Sources and downloads
- IRS Historic Table 2, Tax Year 2023 CSV, all-income rows and fields N1, N11901 and A11901.
- IRS national Historic Table 2 workbook, tax-due-at-filing rows and footnotes.
- IRS TY2023 documentation guide, processing, population and return-address definitions.
- Census Vintage 2025 state population CSV, field POPESTIMATE2023 for July 1, 2023.
- Census dataset layout, including the January 2026 release and population-reference dates.
- Census population-estimate methodology, including how each vintage supersedes the previous series.
- Download the comparison data and population inputs.
The source records, calculations and methodology were checked on 12 and 13 November 2026. The underlying tax year remains 2023.